
Observability

What is Observability?
In Spanish, the word “Observabilidad” is not recognized. However, the term “Observability” in English has been gaining prominence in the field of information technology in recent years. To understand what it refers to, it is necessary to first know how it differs from traditional monitoring.
Monitoring vs. Observability
Monitoring is a constant activity that tends to be reactive when some event or incident occurs with the systems. Observability goes further, as it seeks to have a 360° view of an information technology system through the collection and visualization of data with the analysis of events, which facilitates effective and rapid decision-making.
For this purpose, multiple data sources must be taken into account, considering the nature of the infrastructure, business metrics, APMs, resource consumption, and cloud costs, etc.
The key to Observability is in the intersection and the relationship
existing between data from different sources.
The pillars of observability are metrics, logs, and traces.
Observability is based on 3 fundamental pillars for data collection:
Logs: the log of all events that occurred in the system. Each event has a timestamp and a description that indicate its time of origin.
Metrics It is the numerical representation of a system attribute that can be linked to the performance, consumption, availability, and performance of services.
Tracks It is the record of interconnected events within systems. It sometimes allows for the determination of causes, effects, and potential consequences of what is happening.
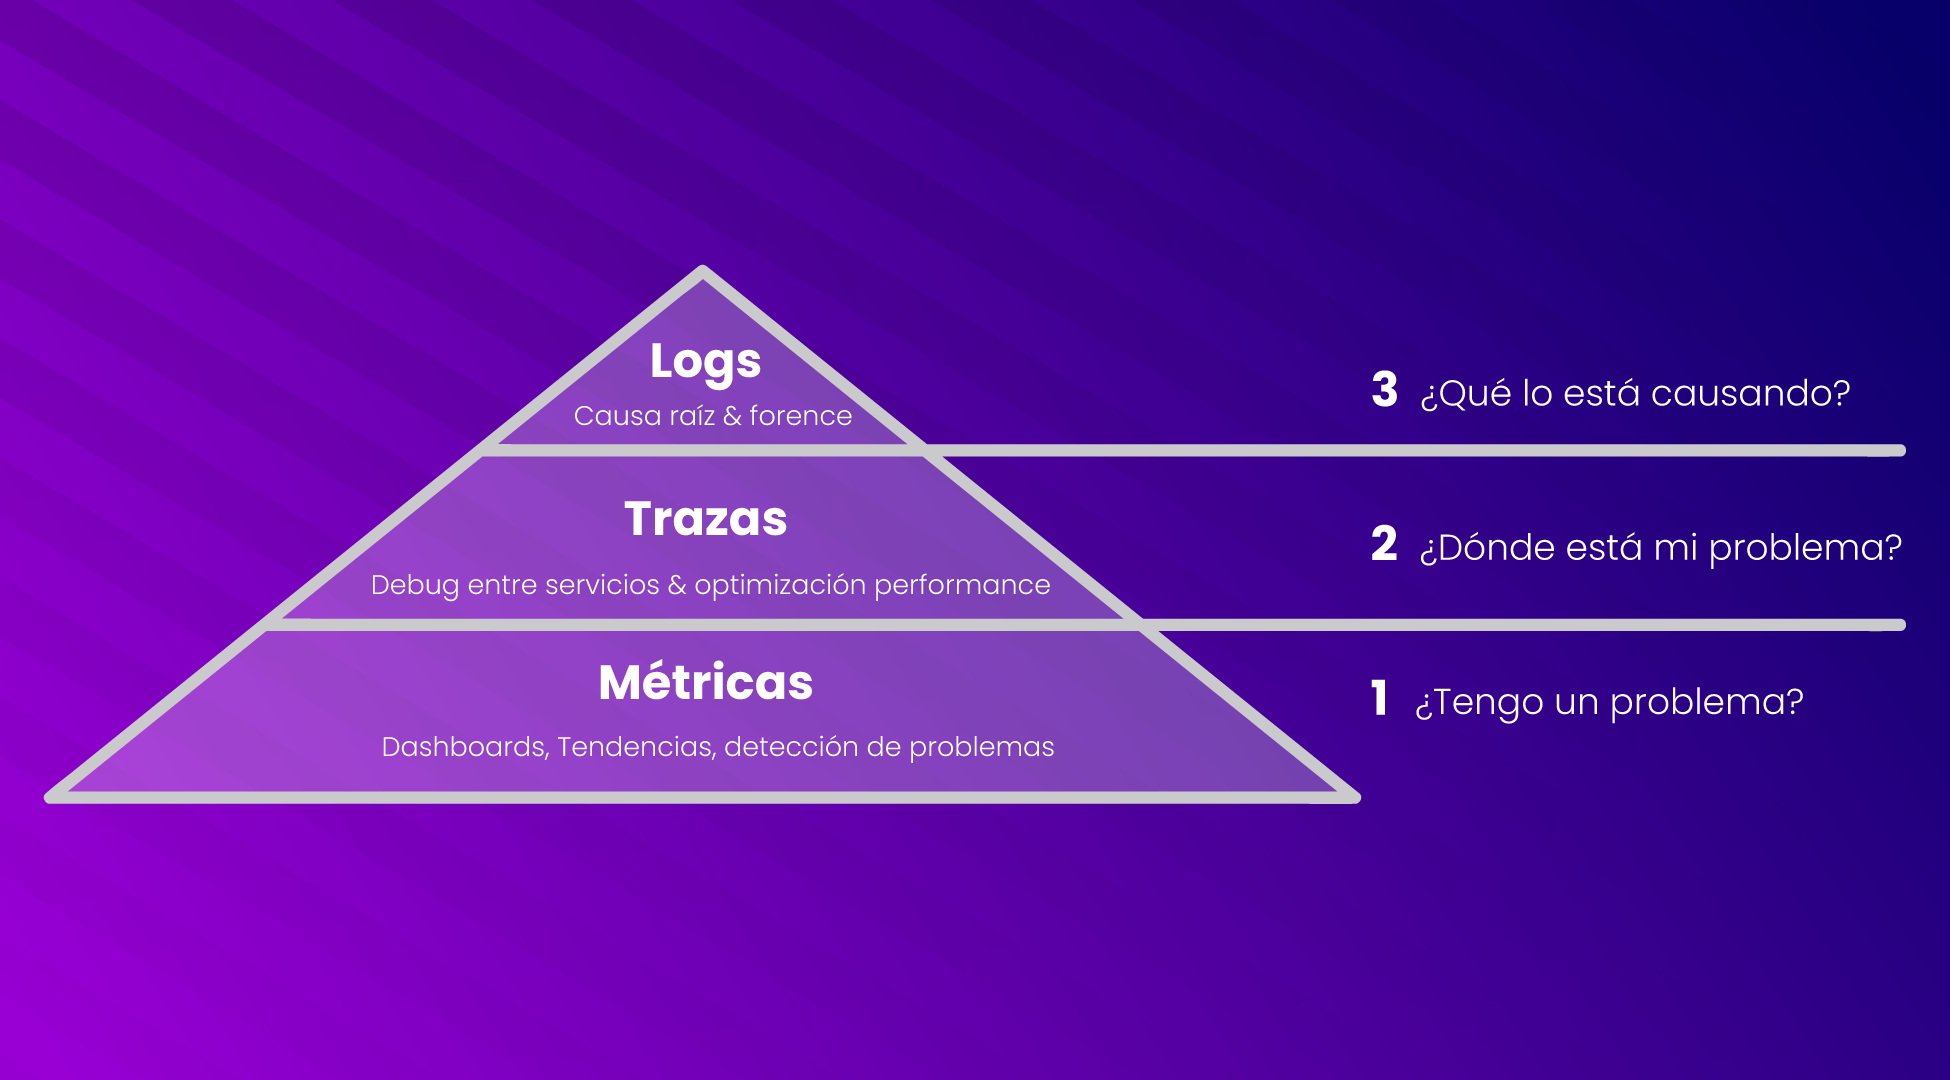
Observability allows for the execution of forensic techniques on information systems to determine the origins of an incident.. In turn, it provides tools that improve infrastructure performance and prevent errors.
How does Observability work?
To illustrate how Observability works, let's think about peak usage of a system. Why? Because during this period, you can see large volumes of service requests.
These massive requests can cause high resource usage (CPU, Memory, Caches, etc.) and at times lead to errors, failures, slowness, or even service outages. Observability analyzes the metrics of requests per second, CPU usage, memory, and disk to understand how the system behaved during this stage. This way, if there was any issue, Observability allows us to know where it originated (traces).
Once this stage is completed and the information has been processed, the logs are inspected, which will allow us to determine the cause of the problem and provide initial indications for short-, medium-, or long-term solutions.
Currently, with the use of cloud services, the previous example can reflect that, during periods of high system demand, the amount of resources can scale dynamically and automatically. Likewise, once that period of time has ended, consumption can return to normal, to its minimum values.
This means that the Observability application allows you to play with cloud service economics and provides the necessary inputs to offer more efficient cloud resource consumption.
From theory to practice: the layered model
Observability is a concept. However, there are platforms that allow you to leverage its principles to create tools and use them within an organization. For this, an interesting layered model is applied:
- IngestionObtaining data from various sources (Logs, Metrics, XML, CSV, TXT, End Points, APIs, SQLs, etc.).
- ProcessingOnce the data is obtained, this layer processes it and performs cross-references to obtain relationship models.
- StorageOnce the data is processed, the resulting information is stored to be available and facilitate its consultation.
- VisualizationThis is the layer where Observability end-users consume the data, metrics, traces, and logs stored in the form of dashboards that will facilitate custom queries and information analysis.
This layered model offers a series of significant advantages, such as the coexistence and interoperability of multiple technologies, scalability according to demand, and the potential growth of data sources. In addition to providing a platform where system administrators, data engineers, executives, managers, and even any type of end-users can participate.
The Observability Revolution
Observability is here to stay. In fact, it has grown so much that industry leaders have committed to creating and implementing technologies and tools to facilitate its adoption. AWS, Azure, and GCP are clear examples of this. On the other hand, companies developing enterprise solutions such as New Relic, Dynatrace, Elastic, and Honeycomb have also incorporated observability into their products. In addition, there are other open-source projects such as Prometheus from The Linux Foundation or initiatives from The Apache Software Foundation like Kafka, NiFi, Spark, and Superset, which help push the boundaries of observability.
In conclusion, in today's digital world where data is of vital importance to all systems around us, the adoption of Observability allows us to approach efficient Data Engineering, gaining observation, prediction, and decision-making capabilities. Finally, it helps IT companies develop platforms with data analytics services for their clients and especially for their internal consumption, creating added value when competing.


